Data Visualization
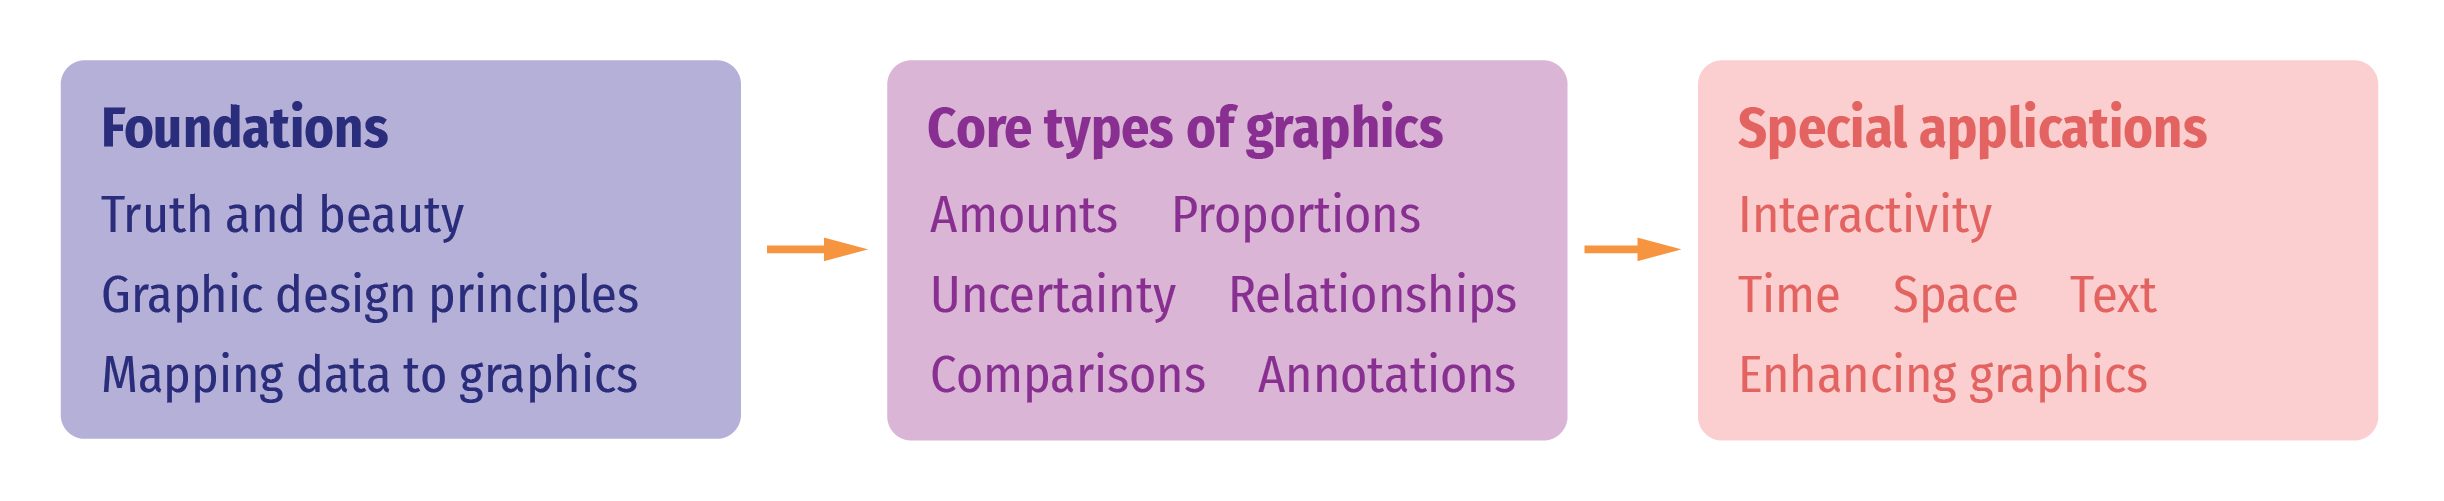
Use R, ggplot2, and the principles of graphic design to create beautiful and truthful visualizations of data
PMAP 8921 • May 2020
Andrew Young School of Policy Studies
Georgia State University
Use R, ggplot2, and the principles of graphic design to create beautiful and truthful visualizations of data
PMAP 8921 • May 2020
Andrew Young School of Policy Studies
Georgia State University
E-mail and Slack are the best ways to get in contact with me. I will try to respond to all course-related e-mails and Slack messages within 24 hours (really), but also remember that life can be busy and chaotic for everyone (including me!), so if I don’t respond right away, don’t worry!