Enhancing graphics
Why enhance graphics?
The content from today isn’t really code-based at all. Instead, you’re learning about how to take a plot from R and make it fancy in a vector editing program like Illustrator, Gravit Designer, or Inkscape.
This concept comes from a common workflow in the real world, where organizations like news outlets, think tanks, research centers, or nonprofits will publish highly polished plots in annual reports, magazines, and other types of publications. These graphics often have to follow specific in-house style guidelines and use specific colors and fonts and other design elements. Even if you don’t work for a place with in-house style guides, you’ll often want to make some edits to your plots by hand after you create them.
The general workflow goes like this:
- Create a plot in R and ggplot
- Export that plot as a vector image (either a PDF or an SVG)
- Edit and enhance the vector image in a vector editor, like Adobe Illustrator
- Export the polished version from Illustrator as either a PDF or PNG (or both)
Big data-focused organizations have been using a process like this for years. Nathan Yau describes this whole process in his 2011 book Visualize This and the book contains a bunch of tutorials to help you learn how create something in R, export it, and edit it in Illustrator.
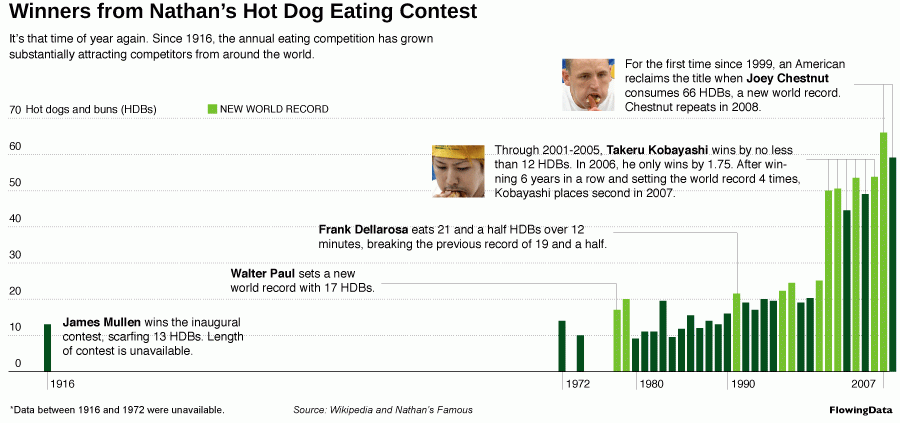
For instance, in his first chapter, he guides you through the process of creating the skeleton of this chart in R, exporting it as a PDF, and adding all the titles and annotations and arrows and extra lines in Illustrator (original post from 2008):
Enhancing graphics in 2020
In 2011, that was the best possible workflow because ggplot couldn’t deal with subtitles, captions, repelled labels, embedded fonts, and differently-styled text (like bold in the middle of a title). Illustrator was the only way to do this stuff.
Nowadays in 2020, though, you can do nearly all of this annotating and enhancing with packages like ggtext and patchwork and ggrepel. You can almost perfectly replicate in-house style guides with the theme() function and put text and arrows and labels and text boxes wherever you want with annotate(). It’s a brave exciting new world.
You still can’t do everything with R. ggplot can’t create fancy font ligatures like “fi” in words that have an “f” followed by an “i”, and it can’t handle automatic hyphenation and full text justification, among other limitations. But these are the minorest of graphic design issues (and the ggplot team is working on them!).
That all said, it’s still often faster and easier to make edits to your graphs in Illustrator rather than fight with a reluctant annotate() layer that just won’t put an arrow exactly where you want. And ggtext is so new (it’s not on CRAN yet) that lots of people haven’t heard of it yet. This is all cutting edge stuff.
So it’s still a good idea to understand how to follow the standard workflow of exporting from R and enhancing in Illustrator.
Abbreviated example
In this video I use the code for the hot dog plot that I provide in today’s assignment to create a plot, export it, and make edits to it both in Illustrator and Gravit Designer. It’s not a complete example at all, but I show you the general process for adding text and lines and editing plot elements.