Enhancing graphics
Getting started
For this exercise, you’ll export a PDF and/or an SVG from R, open it in Adobe Illustrator (free for GSU students) or Gravit Designer (free for the basic version), add annotations and make minor edits, and then export a final polished version.
I have given you 100% of the R code you need to use. All you have to do is run it. You need to download one CSV file:
You should use an RStudio Project to keep your files well organized (either on your computer or on RStudio.cloud). Either create a new project for this exercise only, or make a project for all your work in this class.
To help you, I’ve created a skeleton R Markdown file with a template for this exercise, along with all the code you’ll need. Download that here and include it in your project:
In the end, the structure of your project directory should look something like this:
your-project-name\
  14-exercise.Rmd
  your-project-name.Rproj
  data\
    hot-dog-contest-winners.csv
To check that you put everything in the right places, you can download and unzip this file, which contains everything in the correct structure:
Task 1: Reflection
Write your reflection for the day’s readings.
Task 2: Hot dog eating contest winners
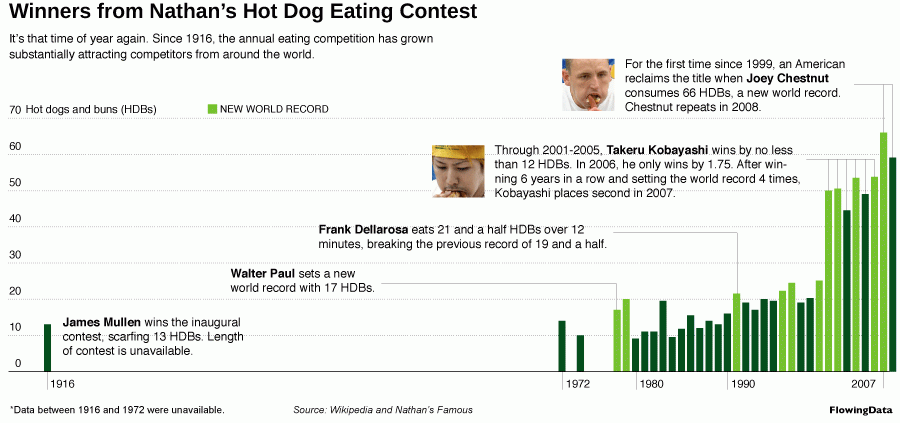
Recreate this plot (or something like it):

Create and save a basic bar chart of hot dog eating contest winners using the code provided. Open the resulting file in Illustrator or Gravit Designer. Open the PDF in Illustrator; open the SVG in Gravit Designer.
Be sure that you save your file in Illustrator or Gravit Designer with a different name. You don’t want to accidentally overwrite all your enhancements and updates when you knit this document. That would be so sad.
You don’t have data prior to 1980, so don’t worry about recreating that half of the graph. You don’t have to put all the text boxes in exactly the same locations—you can even do a completely different design and add different annotations if you want.
The point of this assignment is to help you get familiar with vector editing software, so don’t stress out about R issues or graphic design issues (though try to follow CRAP where possible).
To save you some typing, here’s all the text from the original plot. Copy and paste it into your enhanced version (or change the text if you want—again, do whatever you want):
- Winners from Nathan’s Hot Dog Eating Contest
- It’s that time of year again. Since 1916, the annual eating competition has grown substantially attracting competitors from around the world
- Frank Dellarosa eats 21 and a half HDBs over 12 minutes, breaking the previous record of 19 and a half
- Through 2001-2005, Takeru Kobayashi wins by no less than 12 HDBs. In 2006 he only wins by 1.75. After winning 6 years in a row and setting the world record 4 times, Kobayashi places second in 2007.
- For the first time since 1999, an American reclaims the title when Joey Chestnut consumes 66 HDBs, a new world record. Chestnut repeats in 2008.
- Source: Wikipedia and Nathan’s Famous
Turning everything in
When you’re all done, knit your R Markdown file and use Illustrator or Gravit Designer to export a PDF or PNG version (or both) of your enhanced plot. Upload these files to iCollege.